The Consumer Quits, The Market Buys
Every screen led with a second month of cooling inflation and a September hike that has all but vanished. Underneath it, American households had their worst spending month since May 2025, and the index most exposed to those households closed at a record. Covering the week of August 10 to 16, 2026.
A fortnight ago the labour market printed minus 23,000 and this publication argued the Fed's three dissenters had been fighting over the wrong half of a forecast. The week just gone closed that argument for them. Consumer prices rose 0.1% in July, producer prices did not rise at all, and the odds of a September hike fell to roughly a third, from better than three in four a month ago. That was the headline everywhere. The story sitting underneath it was harder to celebrate: in the same five days the Commerce Department reported the sharpest monthly drop in retail sales since May 2025, the University of Michigan's confidence reading fell to 51, and the Russell 2000, the most domestically exposed index in America, closed at an all-time high.
1. Retail sales fall 0.6% and small caps hit a record anyway
Americans spent $763.6 billion at retailers in July, down 0.6% on the month and the weakest print in over a year. It was broad rather than a one-line quirk: motor vehicles and parts fell 1.8% after a 1.9% rise in June, electronics and appliances fell 0.5%, and online sales, the category that has spent three years refusing to weaken, fell 2.2%. Friday's preliminary confidence reading agreed. Michigan's index dropped to 51 from 55.2, ending two months of gains, with the sharpest falls among older households, lower earners and people without a degree. The survey's own explanation was fuel, energy and food prices, which is to say the war.
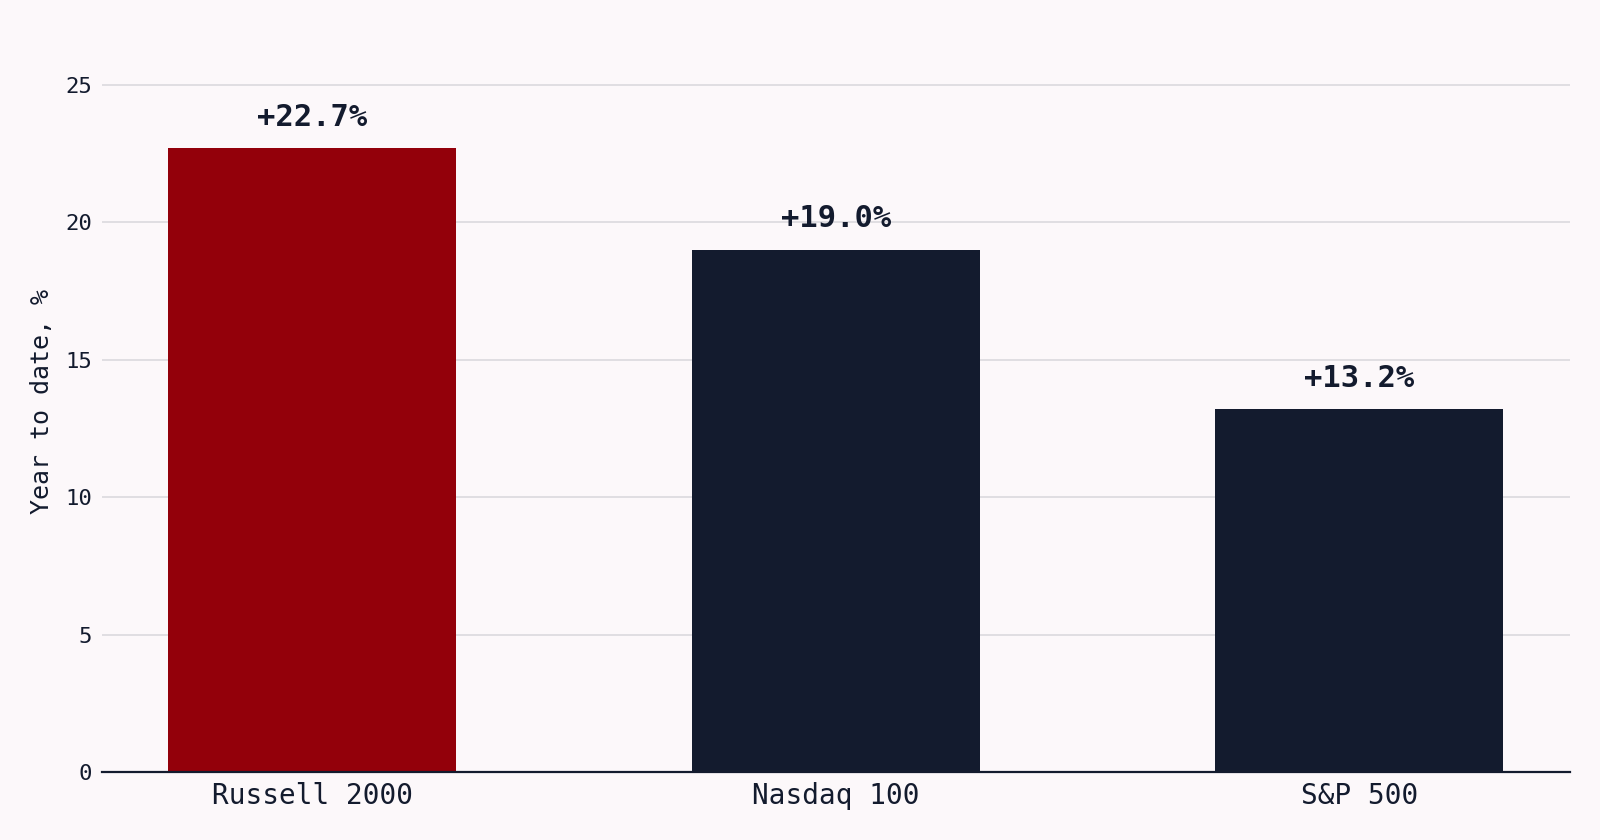
The tape read the same week and bought small caps with both hands. The Russell 2000 rose 1.11% on the week to close at 3,068.42, a record, its twenty-seventh of 2026, and it is now up about 22.7% for the year against 13.2% for the S&P 500. The mechanism is not mysterious: small caps carry more floating-rate debt than megacaps, so a collapsing hike probability is worth more to them than to Nvidia. But it is worth being clear about what that is. The index that lives or dies on American consumer demand hit a record in the week American consumer demand had its worst month in fifteen, and it did so because borrowing costs might fall, not because anyone bought more.
The read: this is a rate trade wearing a growth costume. Small caps are being marked up on the discount rate while the revenue line quietly deteriorates underneath, and the two cannot keep moving in opposite directions forever. Which half of that trade do you think gets repriced first?
2. CPI cools to 3.4% and this publication was wrong
Issue three, in July, said the June inflation report had measured a world that no longer existed, and that the July print due in August would carry the oil spike the June data was too early to see. It did not. Headline CPI rose 0.1% on the month and slowed to 3.4% from 3.5%, core held at 2.5%, and shelter, up 0.1%, accounted for about two-thirds of the monthly increase. Wholesale prices were flatter still: producer prices were unchanged against the 0.2% rise economists expected, with the annual rate falling from 5.5% to 4.7% and energy down 3.1% on the month. Rate futures did the rest. September hike odds, above 75% in mid-July, sat near a third by Thursday.
So why did an energy shock that took Brent from the fifties to the eighties fail to show up? Partly because this shock is a transit problem rather than a price explosion at the wellhead, and partly because the pass-through window is longer than a month. Mostly, though, because of the number in the section above. Firms pass on costs when they think somebody will pay. Households that have just cut spending 0.6% and told a survey they feel worse than at any point this summer are not a pricing environment.
The read: the call here was early rather than harmless, and it is worth saying so plainly. But disinflation that arrives because supply got easier and disinflation that arrives because customers stopped showing up produce an identical line in a CPI table, and only one of them is good news. The market spent the week treating this as the first kind. The retail sales print is an argument that it is the second.
3. Bessent moves the war from Iran's missiles to Iran's ports
On Thursday the Treasury Secretary told reporters that Washington will apply measures to Iran that have "never been seen", that the intent is to isolate the country economically and blockade its ports, and that the package arrives next week. This is the same official whose remark about a Hormuz deal "as soon as Wednesday" knocked 8% off Brent a fortnight ago. The switch from brokering to strangling is the most consequential thing anyone said all week, and oil treated it as one input among several. Two UAE tankers were attacked in the strait the same day. Eight ships crossed the strait on Tuesday, against a ten-day average of twelve and the 130 to 140 a day that was normal before February. Brent closed Friday at $88.52, up 1.67% on the day and nearly 6% on the week; WTI settled at $82.40.
The physical numbers are the ones worth carrying into next week. In its August report the IEA said global oil inventories fell by 2.2 million barrels a day in July, taking measurable stocks below 7.9 billion barrels for the first time since early 2025, and that regional exports, including the routes built to bypass Hormuz, dropped 2.1 million barrels a day. It now expects a deficit of 1.8 million barrels a day in the coming months, more than double what it forecast in July. Meanwhile Russia's refineries, worked over by Ukrainian drones, processed about 3.6 million barrels a day last month, roughly a third below the seasonal norm and the lowest in more than two decades.
The read: for six issues the question here has been which oil risk is mispriced, the one arriving by missile or the one arriving by paperwork. This week both fronts tightened and Brent still needed a burning tanker to move. A market pulling 2.2 million barrels a day out of storage is not balanced, it is borrowing, and a stock drawdown ends one of two ways: the barrels come back, or the price does the rationing instead.
4. Central banks buy 289 tonnes into gold's worst year since 2013
Gold spent the week doing what a rate-sensitive asset does, pushing above $4,400 on the soft CPI and giving it back by Friday to trade near $4,365, roughly 22% below the record of $5,589 it set on 28 January. That drawdown has been read all year as a verdict: the fever broke, the hedge was overbought, the buyers were wrong. Except the buyers who matter most did not sell. The World Gold Council's second-quarter figures show central banks added a net 289 tonnes, up 62% on a year earlier and the strongest second quarter in its records, in the same three months gold posted its steepest quarterly fall in a decade. Poland took 51 tonnes and China 33, its largest quarterly addition since late 2023. Jewellery demand, the price-sensitive kind, fell 17%.
Two different assets trade under one ticker here. The exchange-traded holder owns a position in real rates and sells it when a CPI print goes the wrong way, which is why the redemptions have been heavy. A reserve manager in Warsaw or Beijing owns something else: insurance against the possibility that the dollar system can one day be closed to you. That is not a hypothesis in a week when the Senate has passed a bill threatening 100% tariffs on the largest buyers of Russian energy and the Treasury is promising to blockade a country's ports.
The read: the price of the hedge fell 22% while the institutions with the most to lose from being locked out bought more of it than in any second quarter on record. One of those groups is trading gold and the other is holding it. Which one do you think is looking further ahead than the next inflation print?
Year-to-date index returns through August 14, 2026 · Source: index price data
Week of August 10 to 16, 2026
- minus 0.6%
- US retail sales in July, the sharpest monthly fall since May 2025, with online sales down 2.2%
- 51
- University of Michigan consumer sentiment in August, down from 55.2 and ending two months of gains
- 3.4%
- Annual CPI inflation in July, a second straight month of cooling, which took September hike odds to about a third
- $88.52
- Brent's Friday close, up almost 6% on the week as tanker attacks resumed in Hormuz
- 289 tonnes
- Central bank gold buying in the second quarter, up 62% on a year earlier and the strongest second quarter on record
The week ahead
- The Treasury's Iran package: Bessent has promised measures "never seen" within days, aimed at isolating Iran's economy and its ports. The detail that matters is whether the measures reach the buyers and the shippers rather than Tehran alone, because that is the difference between a sanctions headline and a supply event.
- The retailers report: Walmart, Home Depot and the rest of the big US chains give their read on the quarter over the coming fortnight. July's 0.6% drop was one government survey. Guidance from the companies that actually take the money is the check on it.
- Inventories and transits: the IEA has doubled its projected deficit to 1.8 million barrels a day and stocks are already below 7.9 billion barrels. Weekly inventory data and Hormuz transit counts remain the honest gauge, ahead of anything said about negotiations.
Selected sources
- Bureau of Labor Statistics: Consumer Price Index, July 2026
- Bureau of Labor Statistics: Producer Price Index, July 2026
- CNN: Frustrated US consumers cut their retail spending last month
- TheStreet: Russell 2000 notches fresh record to cap off the week
- CNBC: Oil prices rise as the US threatens "economic isolation" of Iran
- International Energy Agency: Oil Market Report, August 2026
- Bloomberg: US readies unprecedented economic isolation plan for Iran
- World Gold Council: Gold Demand Trends, Q2 2026